Tolerance Stack-Up Calculator (Worst Case, RSS & Monte Carlo)
1D tolerance stack-up with worst-case, RSS, Monte-Carlo simulation, contributors and out-of-spec prediction · free, no signup
Dimension chain (positive = adds to the gap, negative = subtracts)
See Tolerance Stack-Up Calculator (Worst Case, RSS & Monte Carlo) in action
Free Tolerance Stack-Up Calculator
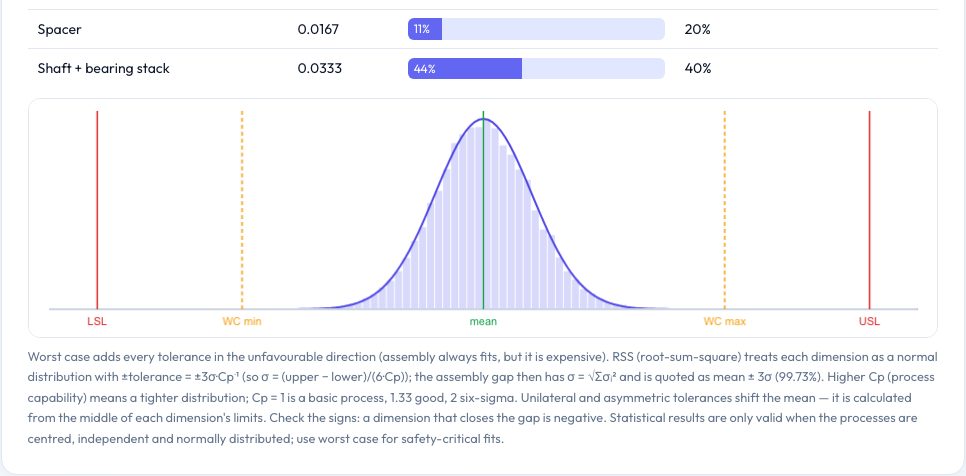
Tolerance stack-ups answer a simple but important question: given the tolerances on every part in an assembly, how big or small can the gap, clearance or overall length become? Enter each dimension in the chain with its nominal value, plus and minus tolerances, whether it adds to or subtracts from the gap, and the process capability, and the calculator returns the mean gap, the worst-case range (every part at its limit in the unfavourable direction) and the statistical RSS range (mean ± 3σ), together with a contribution table showing which dimension drives the variation.
If you also enter lower and upper specification limits for the gap it predicts the fraction out of spec and the Cpk, tells you whether worst case always passes, and optionally runs a Monte-Carlo simulation of 20,000 to 100,000 assemblies with a histogram on the chart. Asymmetric (unilateral) tolerances shift the mean automatically. For the three-part example 25 ± 0.1, 10 ± 0.05 minus 34.5 ± 0.1 the mean gap is 0.5 mm, the worst case is 0.25 to 0.75 mm and RSS is 0.35 to 0.65 mm.
Key features
Worst case and RSS
Both methods side by side, with mean and σ.
Monte-Carlo simulation
Histogram of simulated assemblies and out-of-spec percentage.
Contributor analysis
Which dimension drives the variation — by variance and by worst case.
Cpk and spec limits
Predicted ppm out of spec and Cpk for the gap.
How to use it
- Enter each dimension, tolerances, direction and Cp.
- Enter the lower and upper limits for the gap.
- Read worst-case, RSS and Monte-Carlo results.
- Tighten the biggest contributor and recalculate.
Worked example
Example
A chain of 25 ± 0.1 and 10 ± 0.05 minus 34.5 ± 0.1 has a mean gap of 0.5 mm, worst case ±0.25 mm and RSS ±0.15 mm (σ = 0.05 mm); against limits of 0.1 and 0.9 mm the predicted defect rate is essentially zero.
Who uses this tool
Mechanical designers
Check that parts fit and move at the extremes.
Quality engineers
Predict defect rates and set process requirements.
Students
Learn worst-case versus statistical analysis.
Tips for the best results
- Use worst case for safety-critical fits and RSS for cost-sensitive ones.
- Tighten the biggest contributor first.
- Set Cp to the real capability of each process, not 1.0 by default.
- Double-check each dimension's direction (+ or −).
Common mistakes to avoid
- Getting the sign of a dimension wrong.
- Applying RSS to a handful of non-normal, off-centre processes.
- Forgetting that gaps close when parts are added in the opposing direction.
Why use AZRS QuickFix?
It is 100% free, needs no signup and has no watermark or usage limits. The tool runs in your browser, so what you type stays on your device, and it works on phones, tablets and desktops. New tools are added every week — bookmark this page or browse the full QuickFix toolbox.
Frequently asked questions
What is the difference between worst case and RSS?
Worst case adds all tolerances; RSS combines them statistically as √Σσ².
What is Cp?
Process capability: tolerance width divided by six standard deviations.
Does it handle 2D/3D stacks?
No — one-dimensional chains only.
Is it free?
Yes.