Free Online Graphing Calculator — Plot Any Math Function Instantly
AZRS Graphing Calculator is a free, browser-based tool that lets you plot mathematical functions, parametric equations, polar curves, and inequalities with zero download required. Type any equation and see the graph in real time — no account, no limits.
Why Use AZRS Instead of Desmos?
While Desmos is excellent, AZRS goes further with 50+ built-in math functions not found in Desmos: the Gamma function Γ(x), error function erf(x), Riemann Zeta ζ(s), Fourier series (square, sawtooth, triangle), Bernstein polynomials, machine learning activation functions (ReLU, GELU, Sigmoid/Logistic), number-theory tools (isPrime, totient, digitSum), and more.
What Can You Graph?
- Standard functions — y = sin(x), y = x² − 3x + 2, y = e^x
- Parametric curves — x = cos(t), y = sin(t) (circles, spirals)
- Polar equations — r = sin(2θ) (rose curves, spirals)
- Implicit curves — x² + y² = 25, x²/9 + y²/4 = 1
- Inequalities — y > x², x² + y² < 9
- Piecewise functions — y = {x > 0: x, x < 0: −x}
- Derivatives — y = d/dx(x³)
- Custom function defs — f(x) = x² then y = f(x) + 2
Interactive Sliders & Animation
Add any letter (a, b, c, …) to your equation and a live slider appears automatically. Drag it to explore how parameters change the graph. Click Play to animate the slider and watch the curve move in real time — perfect for understanding transformations, oscillations, and families of curves.
How to Write Equations
- Use
^for powers:x^2→ x² - Use
*for multiplication:2*xor just2x - Write
pifor π,efor Euler's number - Write
thetafor θ in polar equations - Use
sqrt(x),abs(x),ln(x),log(x) - Domain restriction:
y = sqrt(x) {x > 0}
See Free Online Graphing Calculator in action
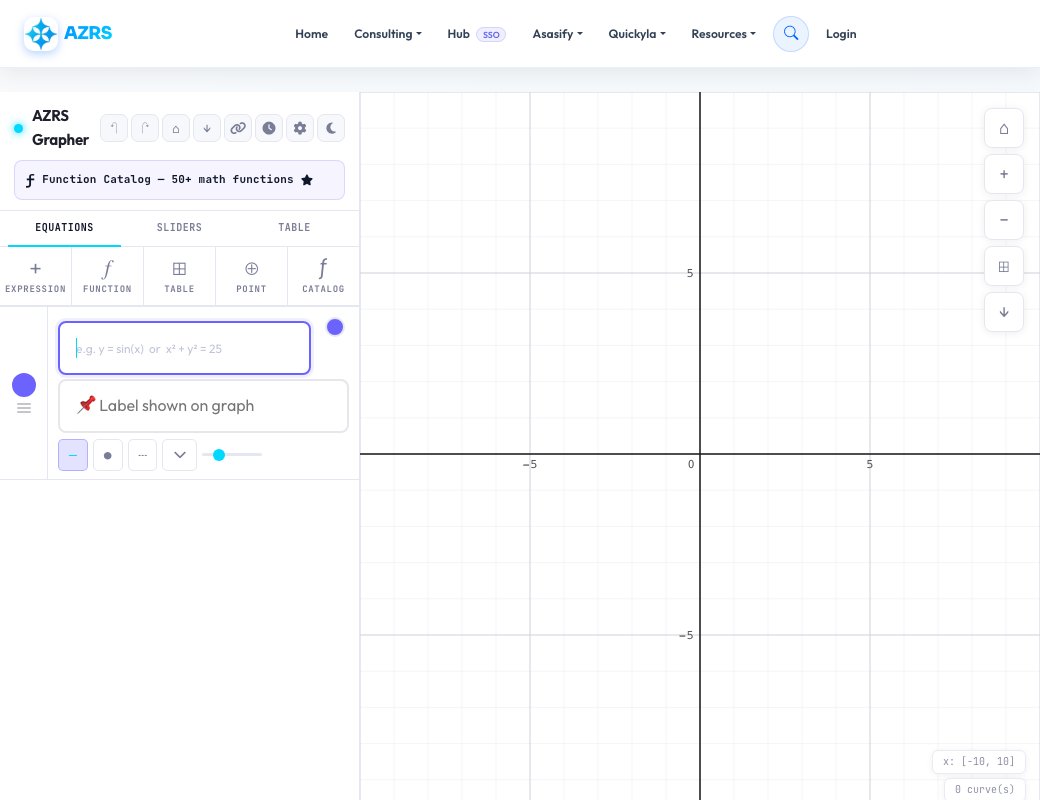
Free Online Graphing Calculator
Plot any mathematical function instantly in your browser — polynomials, trigonometric functions, exponentials, logarithms and more — with pan, zoom and multiple functions graphed together on the same axes. Type an equation like y = x^2 - 4 or y = sin(x) and see it plotted immediately.
Built for the same use cases as a graphing calculator app or physical device: exploring function behavior, finding roots and intersections visually, and building graphs to save, share or use for homework and teaching.
Key features
Plot multiple functions at once
Graph several equations together on the same axes to compare them.
Pan and zoom freely
Explore any part of the graph interactively, not a fixed static image.
Save and share graphs
Save your work to My Graphs and share a link to any graph.
Wide function support
Polynomials, trig, exponential, logarithmic and more, entered as plain-text equations.
How to use it
- Type an equation, such as y = x^2 - 4.
- Press enter or plot to see the graph render instantly.
- Add more functions to compare them on the same axes.
- Save or share the graph once you're happy with it.
Worked example
Example
Typing y = sin(x) and y = cos(x) together plots both waveforms on the same axes, making it easy to see where they intersect.
Who uses this tool
Students
Visualize functions for algebra, precalculus and calculus homework.
Teachers
Build graphs for lessons and share links directly with a class.
Anyone exploring math
See how changing a coefficient or exponent changes a function's shape in real time.
Tips for the best results
- Use standard notation (^, *, /, parentheses) and the calculator will parse most common ways of writing an equation.
- Plot two functions together to visually find their intersection points instead of solving algebraically first.
- Zoom out first to see the overall shape of a function before zooming in on a specific region of interest.
- Save a graph before closing the tab if you want to return to it later — check My Graphs afterward.
Common mistakes to avoid
- Typing an ambiguous expression without parentheses, which can be parsed differently than intended.
- Forgetting to save a graph before navigating away and losing the work.
- Zooming in too far first and missing the overall shape or key features of the function.
Why use AZRS QuickFix?
It is 100% free, needs no signup and has no watermark or usage limits. The tool runs in your browser, so what you type stays on your device, and it works on phones, tablets and desktops. New tools are added every week — bookmark this page or browse the full QuickFix toolbox.
Frequently asked questions
Is this graphing calculator free?
Yes, completely free with no signup required to plot and explore graphs.
Can I graph more than one function at a time?
Yes, add multiple equations and they're plotted together on the same axes.
Can I save my graphs?
Yes, save graphs to revisit them later in My Graphs, and share a link to any saved graph.
What kinds of functions can I plot?
Polynomials, trigonometric, exponential, logarithmic and most standard mathematical functions.
Do I need an account?
No, you can plot and even save graphs as a guest, though logging in keeps them permanently.
Is my graph data private?
Saved graphs are tied to your account or browser session; shared graphs are visible to anyone with the link.