Choose Language
Select a language for news translation.

IonQ raised its 2024 revenue guidance to $280M-$290M after acquiring SkyWater, while Meta reported $60.8B in Q2 revenue with a 31% profit margin despite spendi…
Below is a three month price history chart comparing the stock performance of ABBV vs. IFF: ABBV is currently trading up about 0.1%, while IFF is up about 0.2…
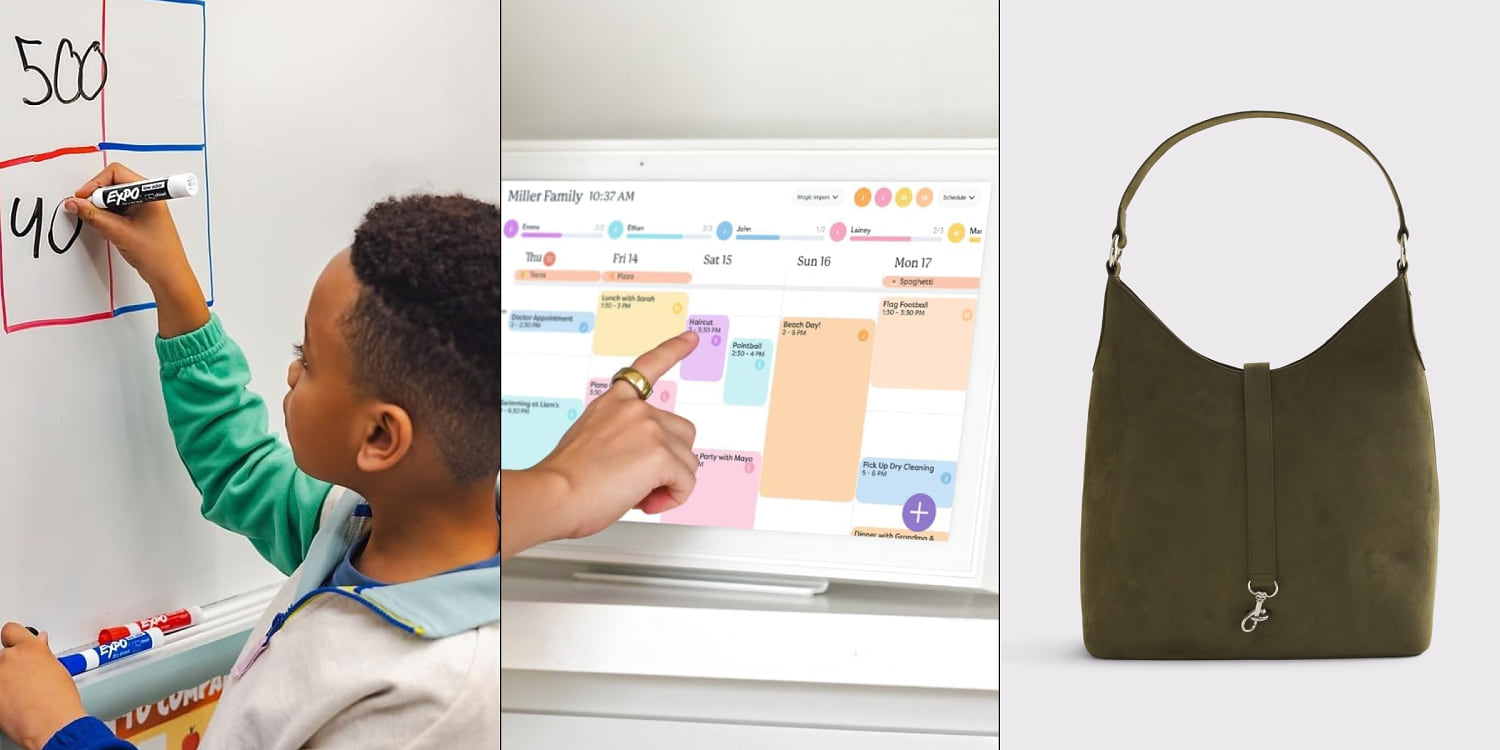
Back-to-school costs hit a record $890 per family due to inflation, with early sales on basics like notebooks and laptops—but some "deals" are fake markups. Ex…
Looking at the chart above, VT's low point in its 52 week range is $130.48 per share, with $162 as the 52 week high point — that compares with a last trade of …
Looking at the chart above, IYR's low point in its 52 week range is $92.45 per share, with $108.17 as the 52 week high point — that compares with a last trade …
Looking at the chart above, VTI's low point in its 52 week range is $309.36 per share, with $383.29 as the 52 week high point — that compares with a last trade…
Written by John Ballard for The Motley Fool -> Vertiv currently demonstrates a much larger and more stable revenue profile, whereas AST SpaceMobile is generat…
Investors are comparing the State Street SPDR Dow Jones REIT ETF (RWR) and the FlexShares Global Quality Real Estate Index Fund (GQRE), with RWR offering lower…
Written by Robert Izquierdo for The Motley Fool -> Microsoft currently displays greater revenue consistency compared to its counterpart, characterized by cont…
Looking at the chart above, AVLV's low point in its 52 week range is $68.68 per share, with $93.35 as the 52 week high point — that compares with a last trade …
Looking at the chart above, PAVE's low point in its 52 week range is $44.9512 per share, with $60.43 as the 52 week high point — that compares with a last trad…